Generating Elementary Cellular Automata SVG designs using Marching Squares
This is a small web application I've made for generating line-based images of Elementary Cellular Automata using Marching Squares.
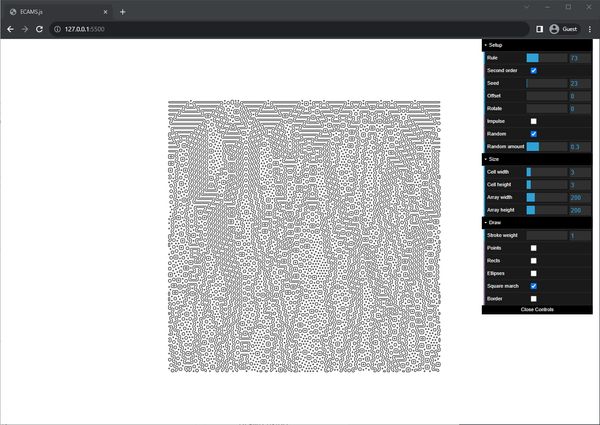
This is how it looks at the minute:
The image is drawn using p5.js, and can be downloaded as an SVG (made using Zenozeng's p5.js-svg runtime).
It has a simple dat.GUI interface and some keyboard shortcuts for interacting with the app.
Some controls are self-explanatory. Size settings allow for adjusting the size of the grid of cells, and the size of an individual cell. Draw settings can be used to toggle the Marching Squares algorithm, or to draw cells as points or shapes. 'Setup' controls require a bit of explanation.
Rule is a Wolfram code. This is an integer between 0 and 255 that describes the rule for the automaton.
Experimental checkboxes are modifications to the rules I'm experimenting with in an attempt to produce more varied and interesting results. They work with the second order rules, so will only affect the resulting output image if Second order is toggled on.
I plan to add more options like these that are based on interfering with the Marching Squares algorithm.
| Action | Keyboard shortcut |
|---|---|
| Change the Seed number for the PRNG that can be used to determine the initial cell states. | s (Chooses a random new seed) |
| Toggle the second-order option to XOR the current cell state with it's state at |
o |
| Rotate the grid of cells left or right. The left edge wraps to the right and vice versa. | ← → |
| Scroll through further iterations. | ↓ ↑ |
Toggle initial cell states between Impulse (only the centre cell is set to 1) and Random (set a randomly distributed proportion of cells to 1) |
i |
Change the proportion of cells that will be randomly set to 1 |
, . |
| Download SVG | d |
After downloading an image, I use vpype to optimise the file with line merging and sorting, and then plot it out using the Inkscape AxiDraw plugin.
Updated 2024-03-04